🎯 Core Takeaway A long wick at a key level is absolute proof that institutional players are hunting liquidity and scooping up orders. Memorize these 6 patterns and the 5-step checklist, and you will be trading alongside the big Wall Street money, not against them.
🔍 Chart Breakdown These two images are your cheat codes for reading single candlesticks:
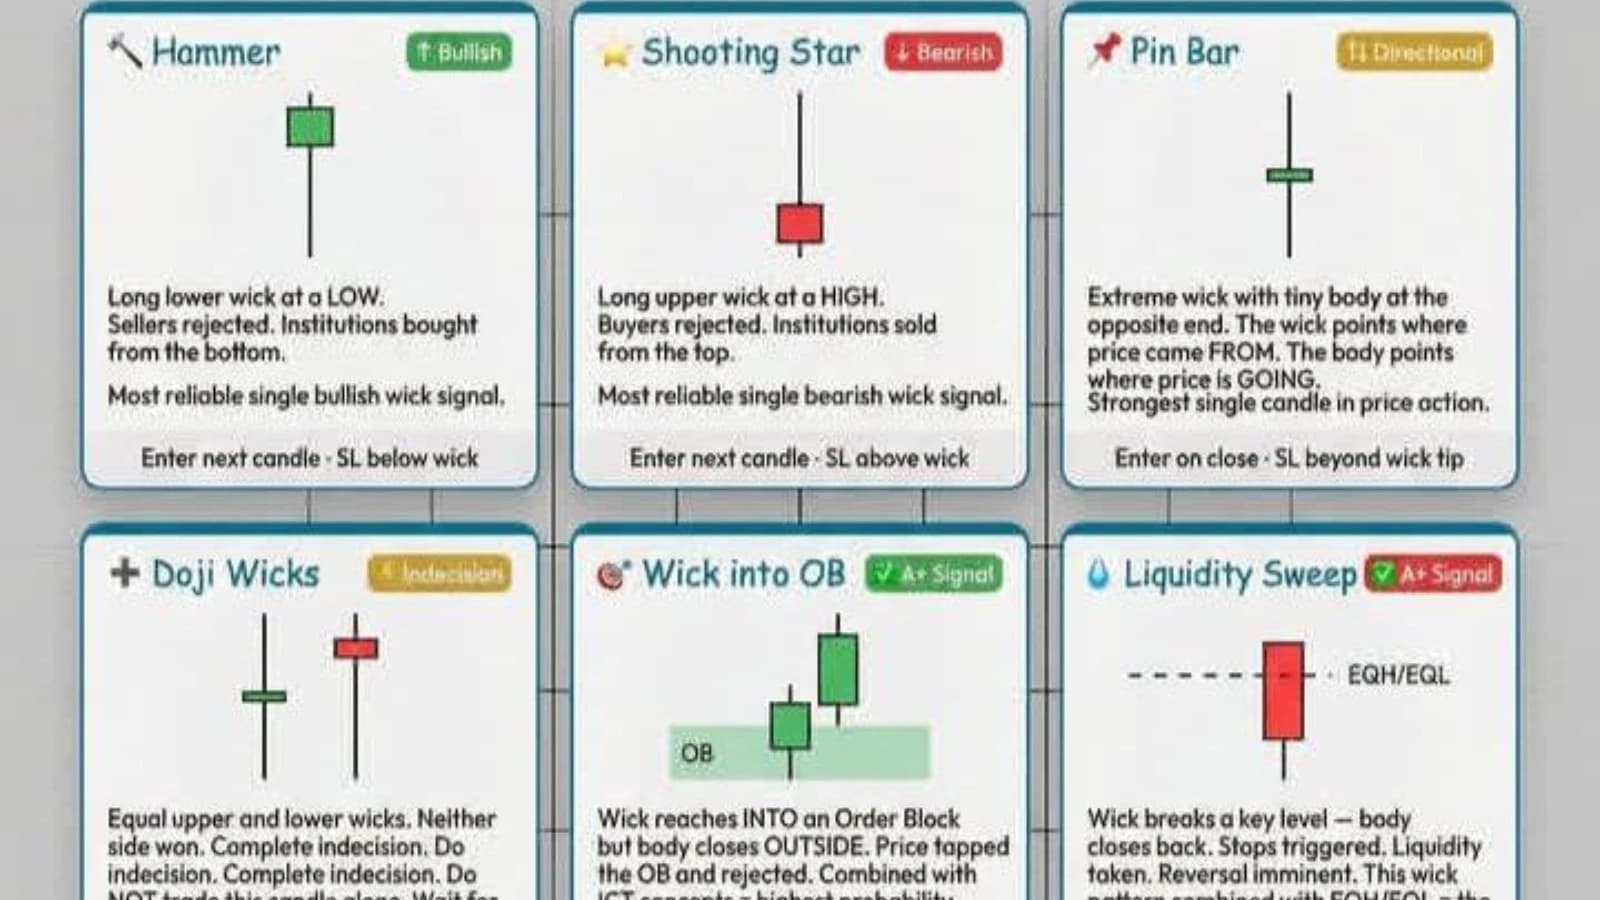
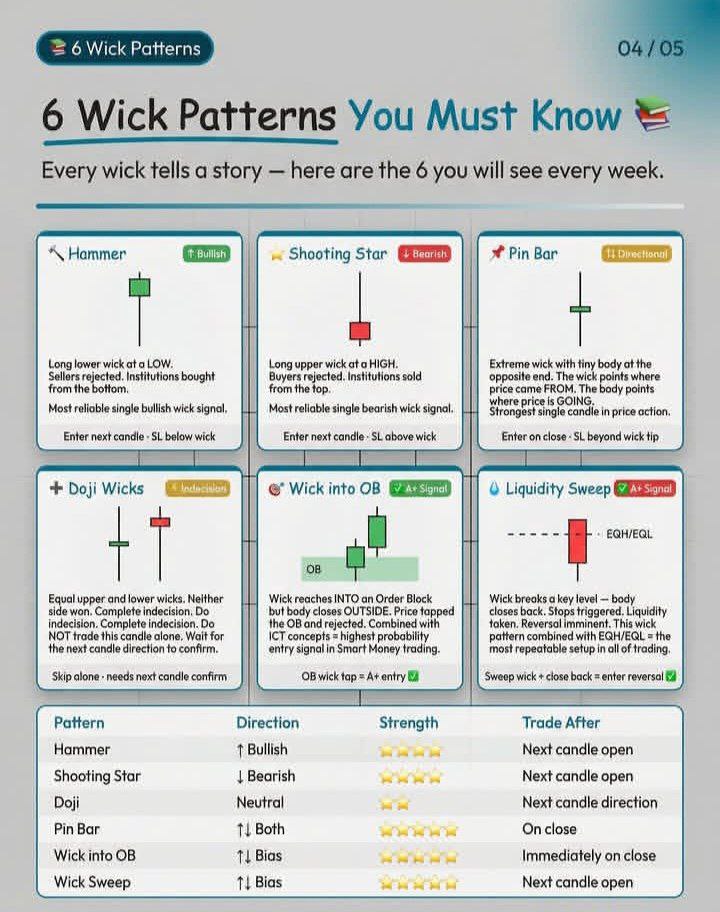
The 6 Essential Wick Patterns (Image 1):
Hammer / Shooting Star: Looks like a hammer. A long lower wick means price dropped but buyers forcefully pushed it back up (bullish). A long upper wick means sellers hammered the price down (bearish).
Pin Bar: The ultimate reversal weapon. It has a tiny body and a massive tail. The tip of the wick points to where the price found a brick wall of resistance.
Doji Wicks: Equal wicks on both sides mean a tug-of-war between buyers and sellers. Complete indecision. Skip it and wait for the next candle.
The A+ Signals (Wick into OB & Liquidity Sweep): The wick perfectly taps into our drawn Order Block (OB) or stabs past a previous high/low (triggering retail stops) and immediately closes back inside. This is the clearest footprint of Smart Money entering the market.
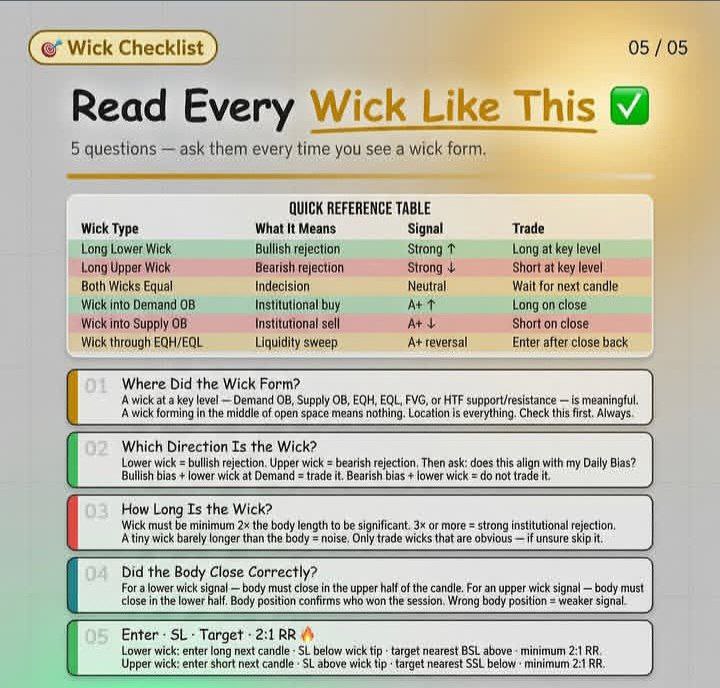
The 5-Step Checklist (Image 2): This is your mandatory pre-trade protocol. Before you click buy or sell, you must confirm the wick's location, direction, length, body close, and ensure your Risk-to-Reward ratio is on point.
📖 Trading Knowledge (The "Why") Why do these massive wicks happen? Imagine you are running a massive wholesale business dealing in BTC or Gold (XAUUSD). You want to buy a huge amount of inventory. If you just buy everything at once, the price will skyrocket, and your average entry cost will be terrible.
So, what do the big Wall Street institutions do? They intentionally sell a little bit to push the price slightly below a well-known "support" level. Retail traders see the support break and panic-sell to cut their losses. During those few minutes of panic, the institutions open their giant wallets and absorb all that cheap, stop-loss liquidity.
On the chart, this manipulation leaves behind a long lower wick (a liquidity sweep). That wick is simply the graveyard of retail stop losses and the exact entry point of the big players.
⚔️ Beginner's Action Plan When you are trading SOL or BTC, strictly follow these 5 steps when you spot a long wick:
Where (Location is everything): The wick MUST form at a high-probability Demand/Supply Order Block (OB), a Fair Value Gap (FVG), or sweep previous equal highs/lows (EQH/EQL). A wick floating in the middle of nowhere is garbage. Ignore it.
How Long (Size matters): The wick must be at least 2x the size of the candle body. If it’s 3x or more, that's massive institutional rejection. Tiny wicks are just noise.
Did it Close Correctly? (The 15-Minute Rule): Drop down to your 15-minute timeframe. If you are looking for a long (buy) setup, the 15-minute candle body must close in the upper half of the total candle length. This proves buyers won that 15-minute battle.
Enter & Set SL: Once that 15-minute candle officially closes, enter the trade on the open of the very next candle. Place your Stop Loss (SL) just a few pips beyond the extreme tip of the wick.
Target (TP): Aim for the nearest Liquidity Pool (like the most recent swing high or low). Ensure your potential profit is at least twice your risk (Minimum 2:1 Risk-to-Reward).
⚠️ Fatal Mistakes to Avoid
Jumping the Gun Before the Close: This is how beginners blow their accounts! You are watching the 15-minute candle form, it looks like a beautiful bullish rejection wick, and you hit 'buy' early. In the final 30 seconds, institutions dump it, and your beautiful wick turns into a giant, solid red candle. Never trade a wick until the timer hits 00:00 and the candle completely closes.
Trading Wicks Without Context: Do not buy a random "Hammer" candle halfway up a massive downtrend. If the wick is not interacting with a key structural level (like an OB), it has zero predictive value.