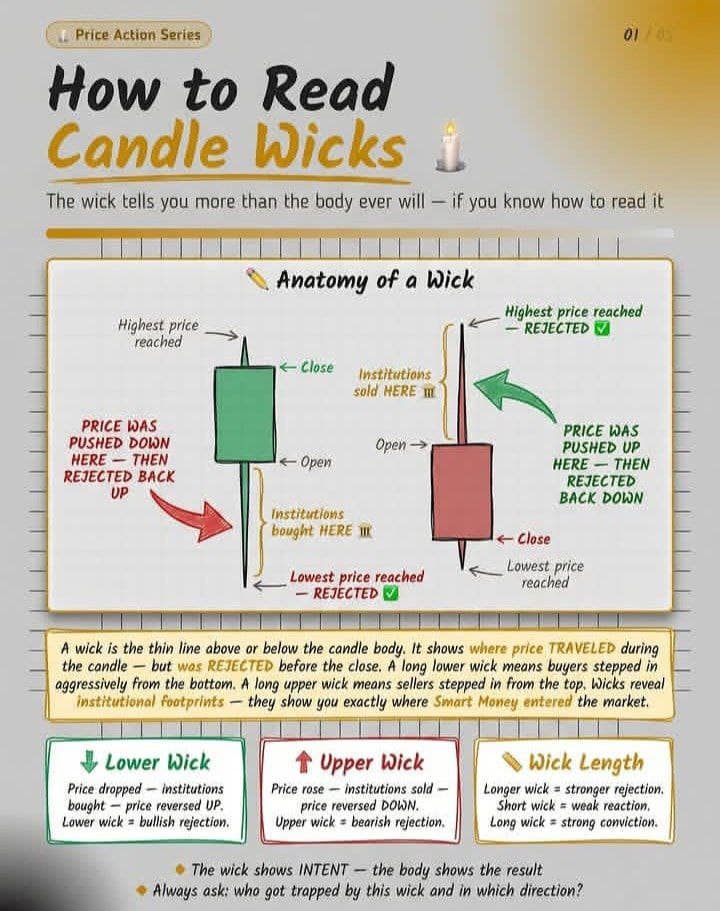
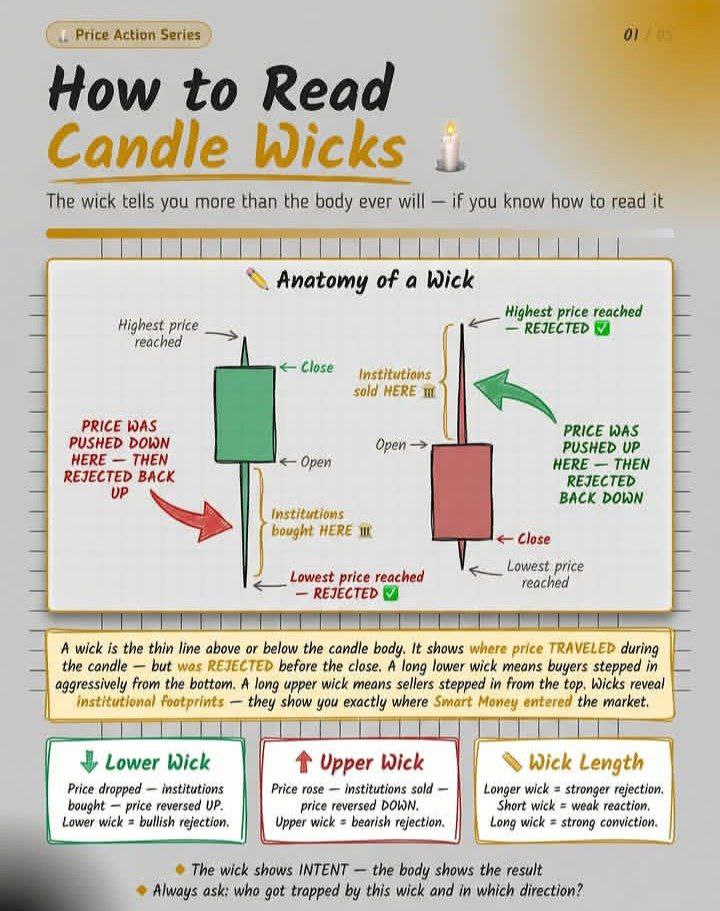
The wick shows INTENT. The body shows the RESULT. A long wick is not random. It is the exact footprint of big institutions (Smart Money) trapping regular retail traders, absorbing their stop losses, and aggressively reversing the market direction.
Here is exactly what those images show in plain English:
The Basics (Image 1): The wick (the thin line) shows where the price went but got rejected.
Lower Wick: Price went down, but big buyers stepped in and pushed it back up. (Bullish)
Upper Wick: Price went up, but big sellers smashed it back down. (Bearish)
The Golden Rule: The longer the wick, the stronger the rejection.
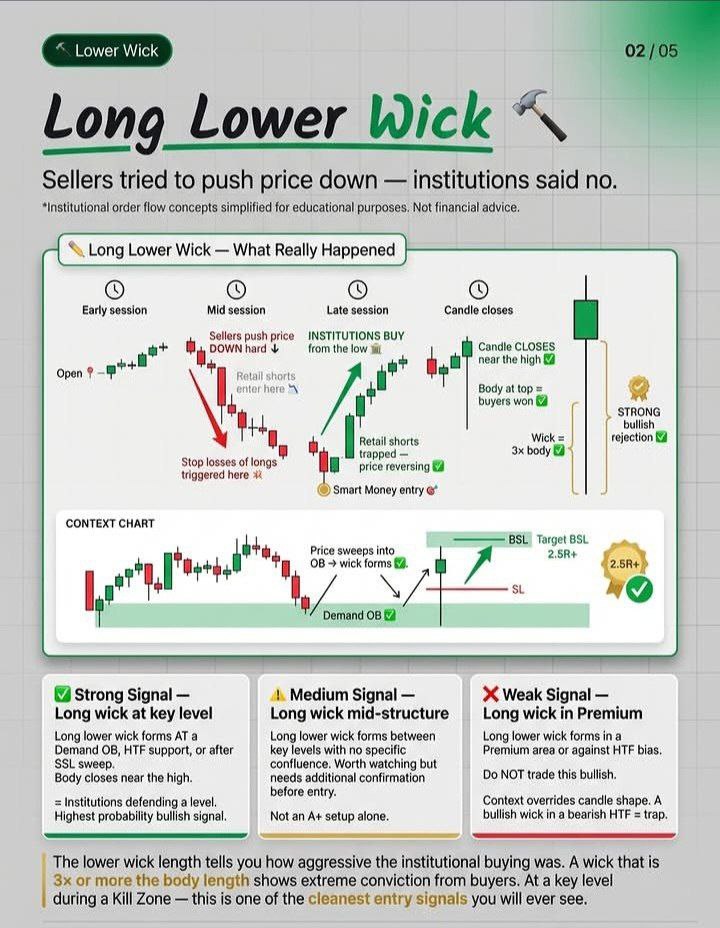
The Bullish Trap (Image 2): Price drops hard. Retail traders panic and sell. But it’s a trap. Institutions buy up all that cheap supply, forcing the price back up. The candle closes with a long bottom wick that is at least 3x bigger than the body.
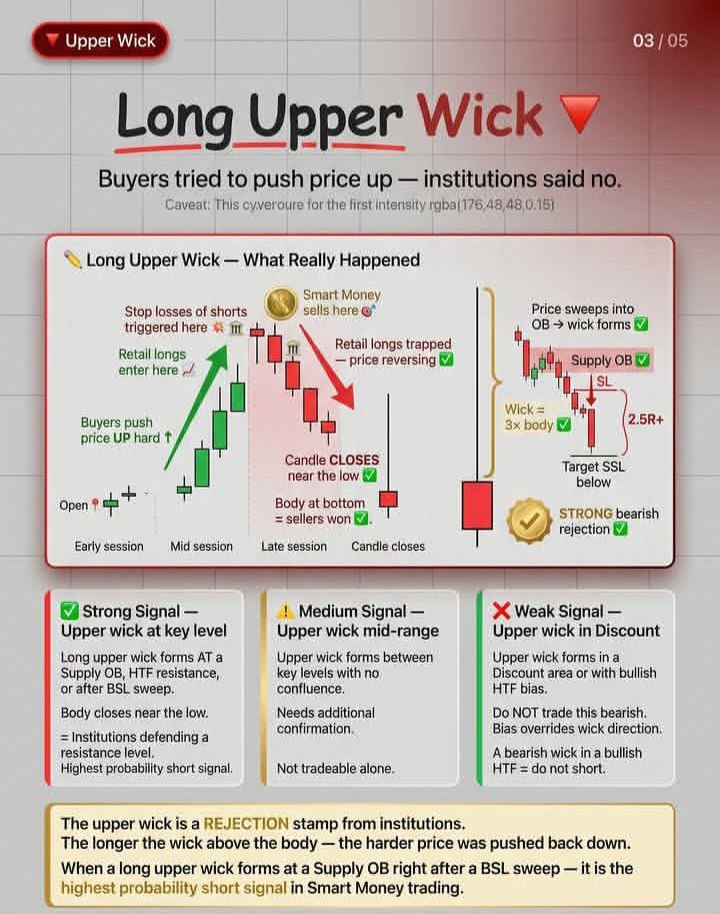
The Bearish Trap (Image 3): Price shoots up. Retail traders get FOMO and buy. Institutions use this buying frenzy to dump their massive sell orders. Price crashes back down, leaving a massive upper wick.
The Supermarket Example: Imagine an apple usually costs $2. Suddenly, a rumor causes panic, and farmers sell their apples for $0.50. A giant supermarket sees this huge discount and buys every single apple. The price immediately skyrockets to $3. That quick drop to $0.50? That is the "wick." The supermarket trapped the panic sellers.
The Market Reality: Big institutions trade hundreds of millions of dollars. They can't just click "buy" without messing up the price. If they want to buy massive amounts of BTC, SOL, or XAUUSD, they need you to sell. So, they push the price past obvious support levels to trigger everyone's Stop Losses. Your panic sell order becomes their perfect buy entry.
Here is how you trade this setup like a pro:
Find the Zone: Open your chart and find a high-probability Higher Timeframe (HTF) Demand or Supply Order Block (OB).
Wait for the Sweep: Drop down to your 15-minute timeframe for the entry. Watch for the price to stab into your Order Block and sweep the liquidity.
Confirm the Wick: The 15-minute candle must form a wick that is at least 3x the size of the body.
Enter the Trade: Wait for the 15-minute candle to completely close. Never enter while the timer is still ticking. Once it closes, enter at the market price, or set a limit order at the 50% midpoint of the wick.
Set SL & TP: Place your Stop Loss (SL) safely just beyond the extreme tip of the wick. Set your Take Profit (TP) at the next major liquidity pool, aiming for at least a 1:2.5 Risk-to-Reward ratio.
Trading in "No Man's Land": Do not trade random long wicks in the middle of a chart. A wick is only powerful if it happens exactly at a key Order Block or after a liquidity sweep.
Jumping the Gun: Entering before the candle closes is a death sentence. A beautiful 15-minute rejection wick can turn into a massive, solid red candle in the last 30 seconds. Wait for the close.
Fighting the Trend: Do not short a bearish-looking wick if the overall market is in a massive, aggressive uptrend. Context always matters more than the shape of a single candle.