Do not try to catch falling knives. Let the 4-Hour (H4) chart do the heavy lifting by sweeping major liquidity, creating a trap for retail sellers. Once that trap is set (your Point of Interest), zoom into a lower timeframe to confirm the institutional reversal before placing your trade.
Here is exactly what these three images illustrate about this entry model:
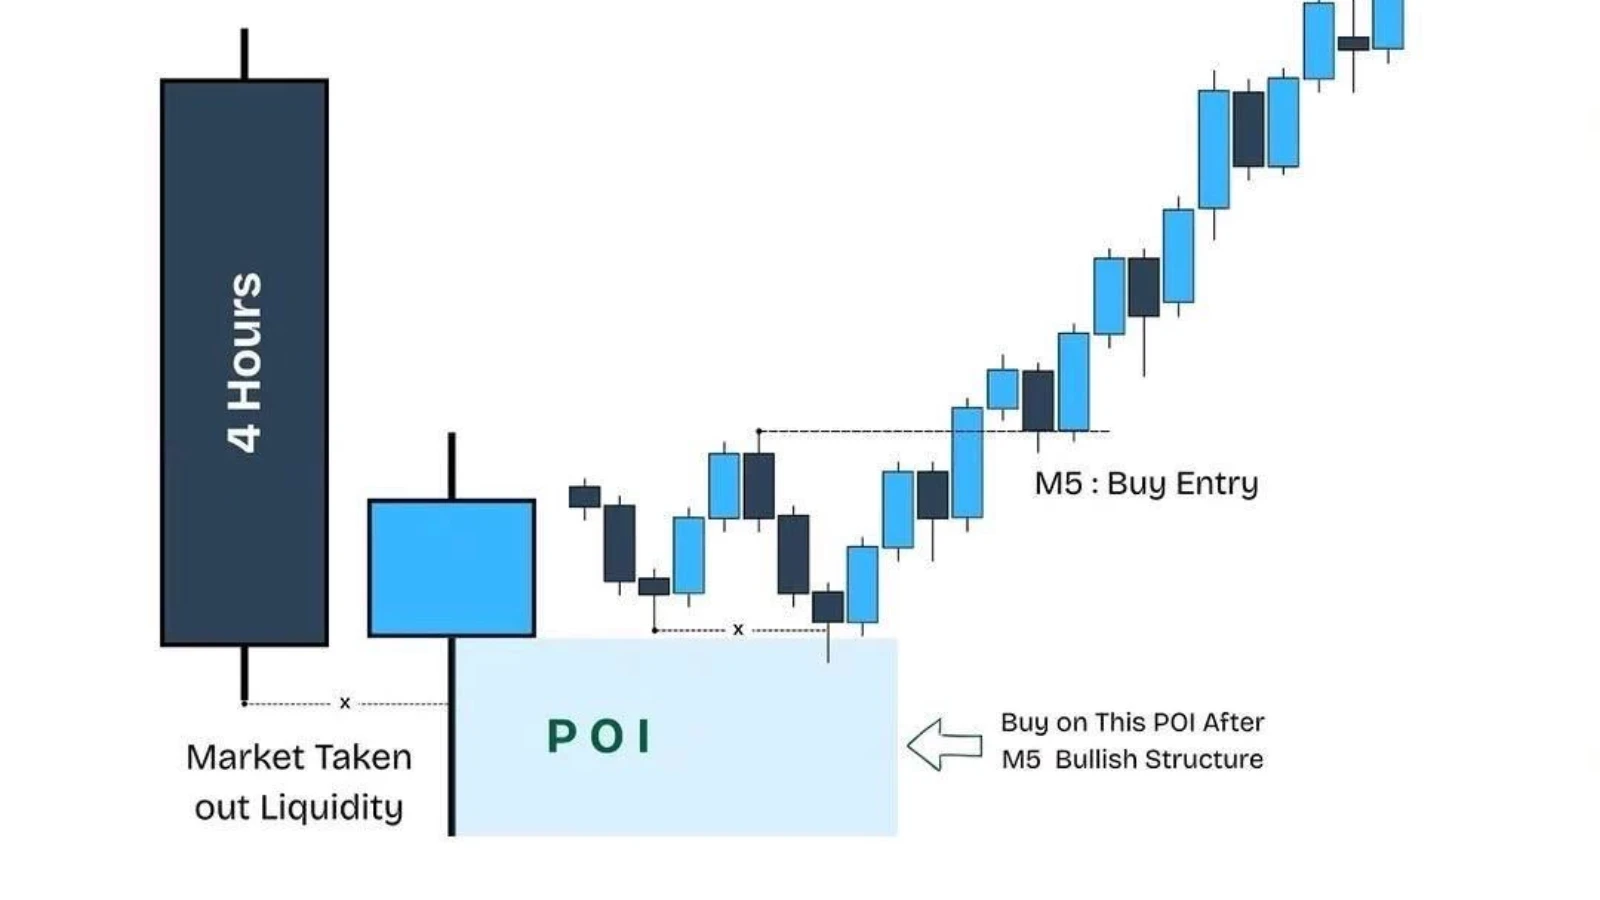
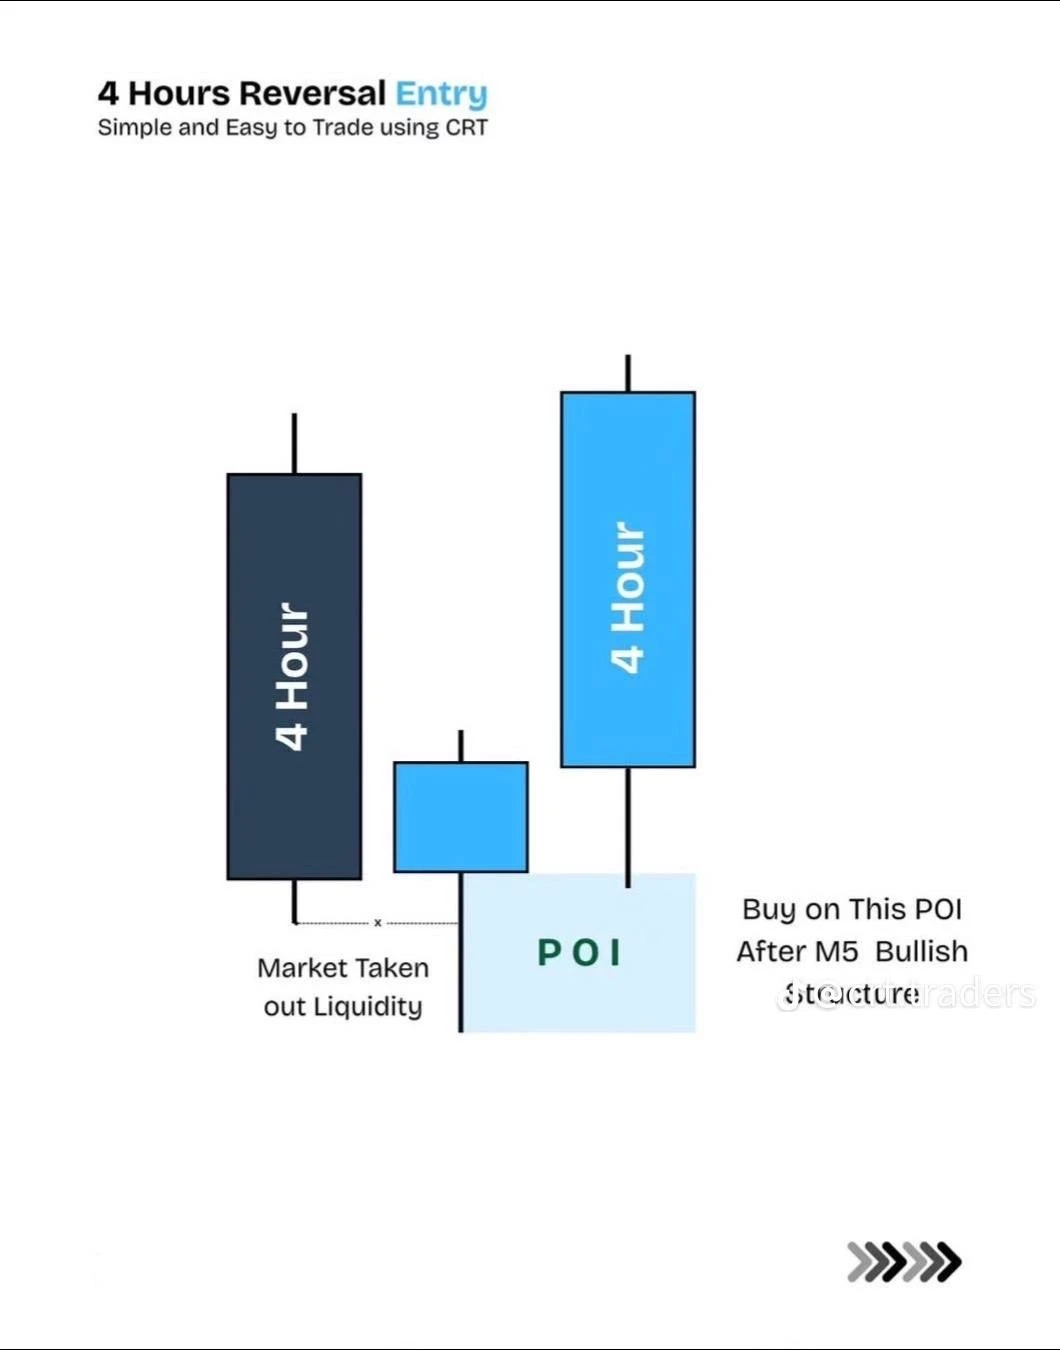
The Setup : You need a 4-Hour candle to drop below the low of the previous 4-Hour candle, which takes out market liquidity. The specific area where this sweep occurs becomes your Point of Interest (POI). You must wait for a lower timeframe bullish structure to form inside this POI before buying.
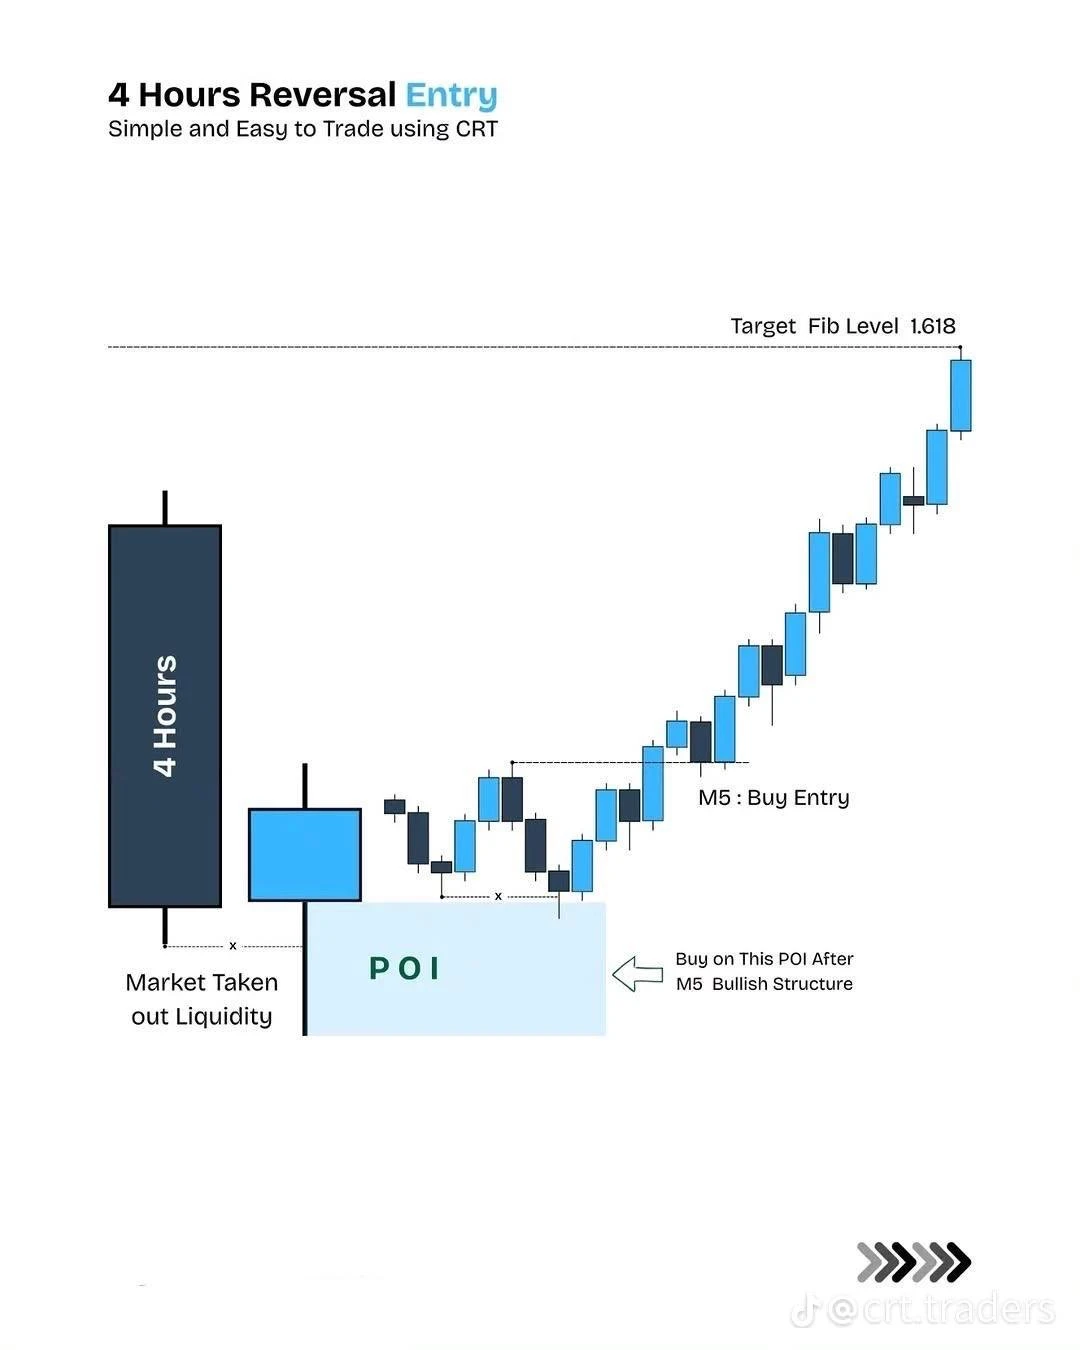
The Entry & Target : Inside the established POI, you zoom into a lower timeframe (the image shows an M5 chart) to look for a bullish structure shift. You execute a buy entry on the pullback within this lower timeframe structure. The ultimate take-profit target for this setup is the 1.618 Fibonacci extension level.
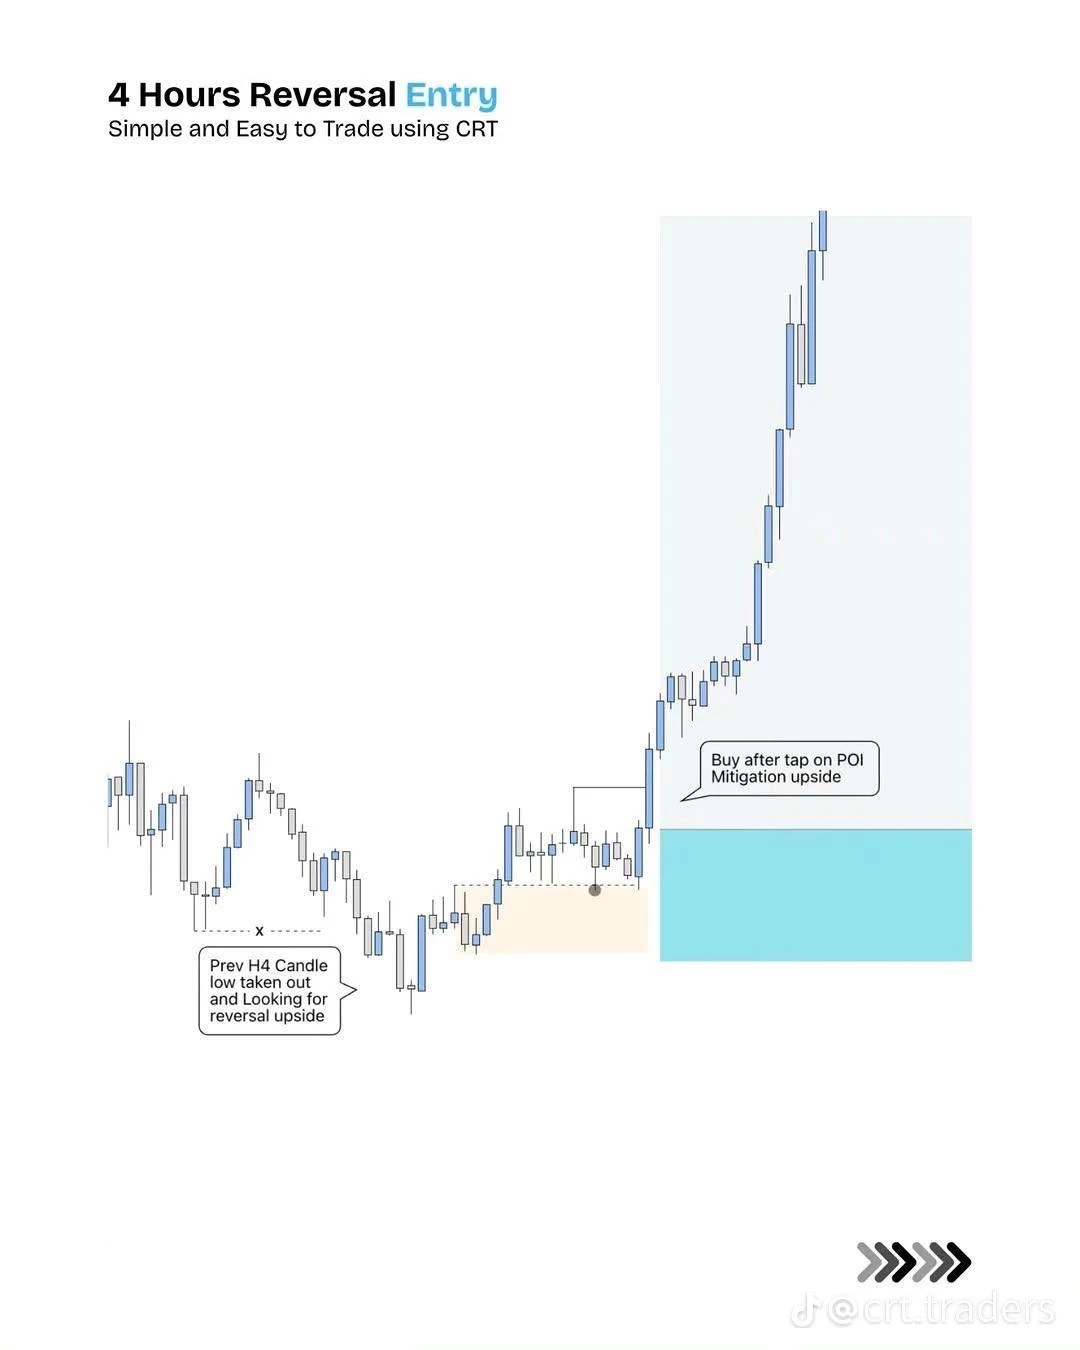
Real Chart Example : This shows the theory in live market conditions. The previous H4 candle low is taken out, signaling a potential upside reversal. The price taps into the marked POI, mitigates the zone, and then launches into a massive upward rally.
The Timeframe Trap: Retail traders often stare at one single timeframe. They see a 4-Hour candle breaking support and aggressively enter short (sell) positions because they think the market is crashing.
Smart Money knows this. They intentionally push the price just below the previous 4-Hour candle's low to trigger those breakout sellers and hit the stop losses of early buyers. This creates a massive pool of sell orders. Institutions buy up all those sell orders at a discount. That manipulation zone is your Point of Interest (POI).
However, buying blindly just because a low was swept is dangerous. That is why you must drop to a lower timeframe to watch for a shift in market structure. The lower timeframe shift is the "confirmation" that institutions have finished accumulating and are now actively driving the price back up.
When scanning your watchlists for BTC, SOL, or XAUUSD, execute this strategy exactly like this:
Spot the Sweep (H4): Watch your 4-Hour chart. Wait for the current H4 candle to stab below the lowest point of the previous H4 candle.
Mark the POI: Draw a box around the wick and the immediate area where that liquidity was swept. This is your Point of Interest.
The 15-Minute Shift: While the textbook example shows a 5-minute chart, drop down to your preferred 15-minute timeframe for a more reliable, noise-free signal. Watch the 15-minute candles inside your POI box.
Confirm & Enter: Wait for the 15-minute chart to create a clear bullish Market Structure Shift (a "Good CHoCH" with a strong impulse breaking a lower high). Once structure shifts, set a limit order on the 15-minute Order Block or Fair Value Gap left behind.
Target: Pull your Fibonacci retracement tool from the start of the reversal impulse to its peak. Set your final Take Profit (TP) at the 1.618 Fib extension level.
Blindly Buying the Sweep: Never place a buy limit order exactly at the previous H4 low. If the market is in a true macroeconomic crash, it will slice right through your POI. Always wait for the 15-minute structural shift to prove the reversal is real.
Impatience in the POI: Sometimes the price will chop around inside the POI for hours before giving a clear 15-minute entry signal. Let the structure form. Do not force a trade if the lower timeframe remains bearish.